Importance-Weighted Bounds
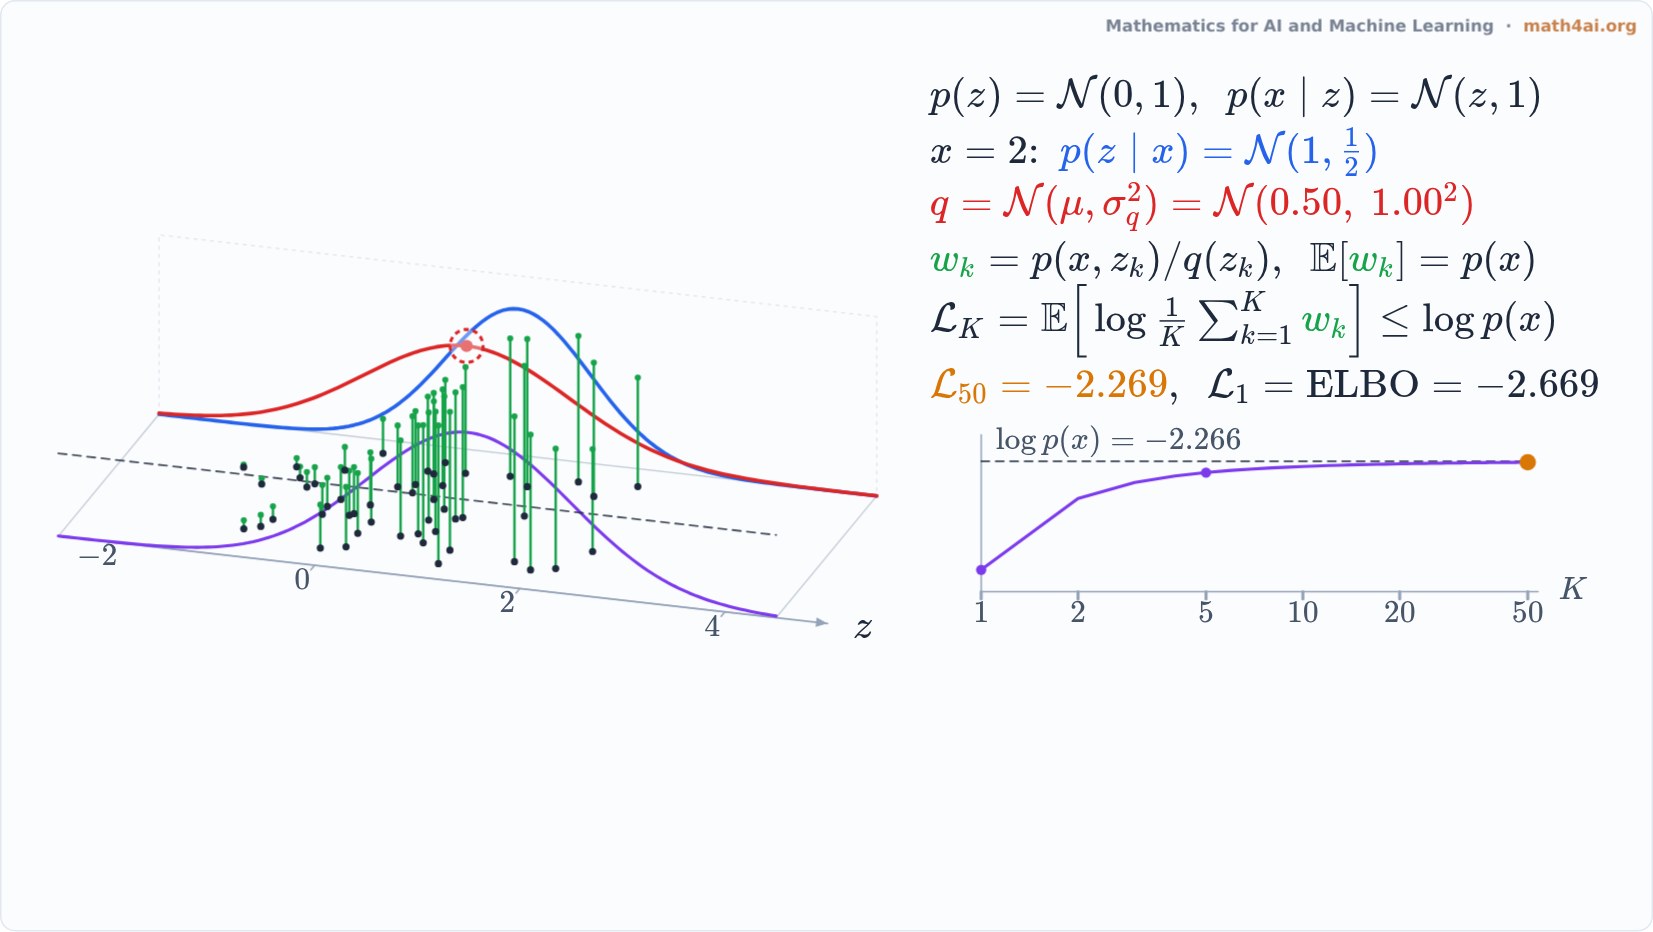
An interactive live film: importance weights of K samples from q against the true posterior, and the bound L_K rising with K toward log p(x); drag the proposal and choose K.
Narration
The prior on z is a standard normal, x given z is normal with mean z, and we observe x equal to two. The blue curve is the true posterior. The red curve is the proposal q, a normal with mean one half and variance one.
Draw samples from q: they are the dots on the floor. Each sample gets an importance weight, p of x and z over q of z, drawn as a green stick. The purple curve is the weight as a function of z, and the dashed line is its average, p of x.
The rest of the narration is in the book's Companion.
More from Chapter 16
 Interactive1:46The Reparameterization Trick: Differentiable SamplingChapter 16
 Preview1:27Monte Carlo: Averages That Close In Like a FunnelChapter 16
 Preview1:42Mean Field: Independent Factors for a Correlated PosteriorChapter 16
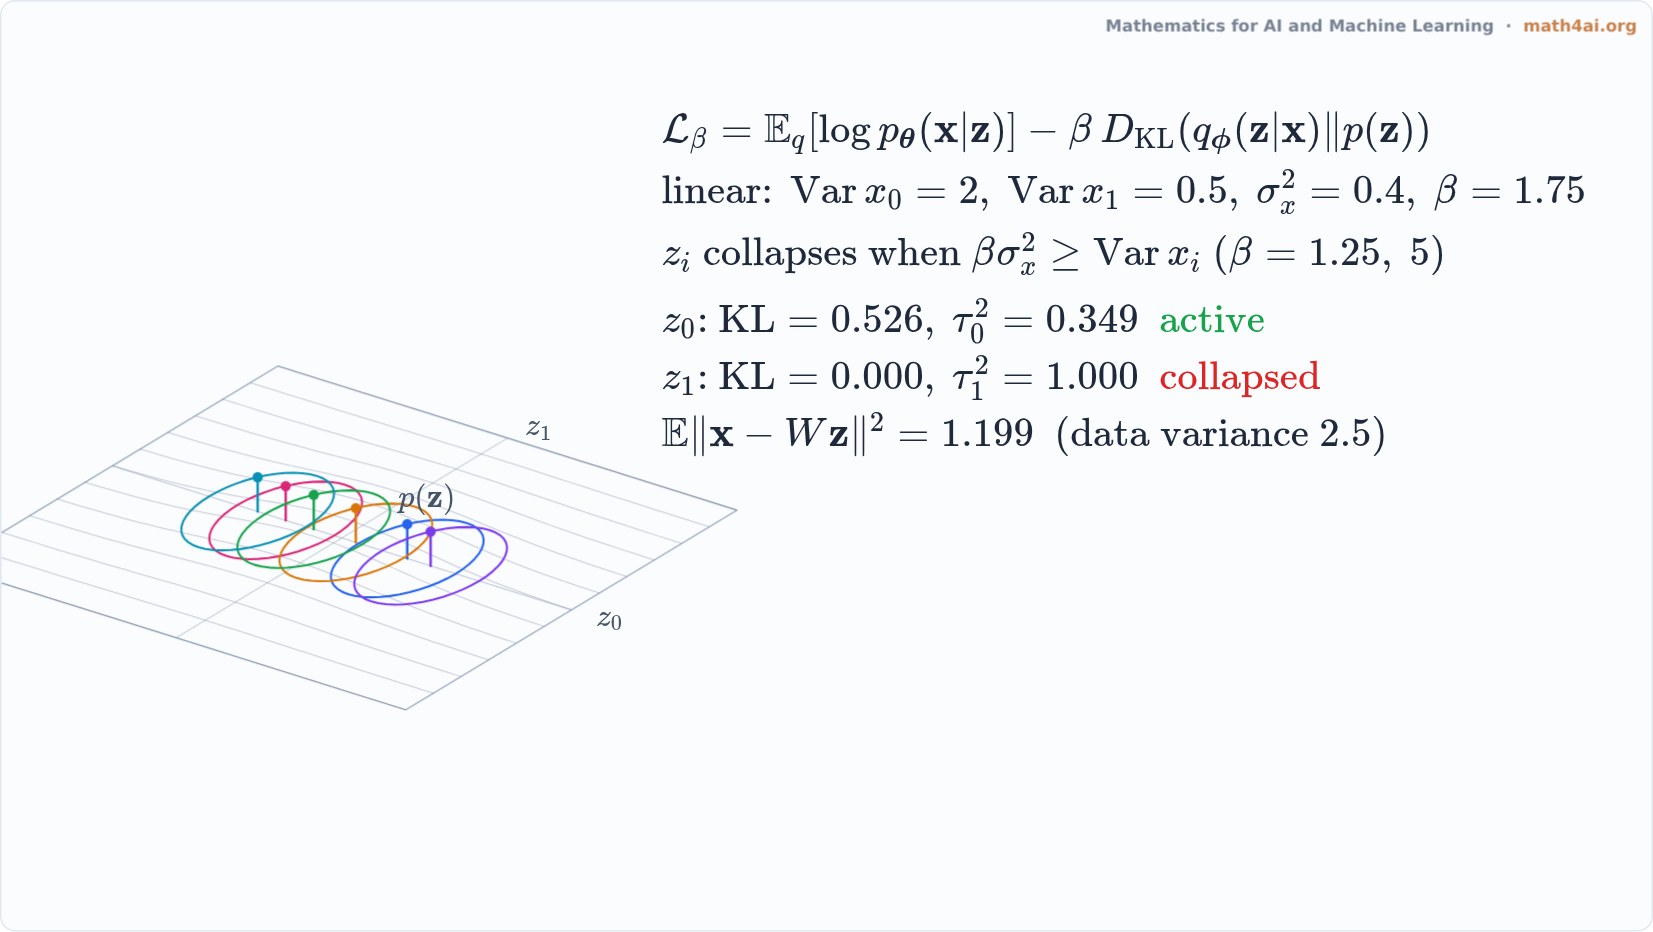 Preview1:45Posterior Collapse: When Latents Vanish into the PriorChapter 16
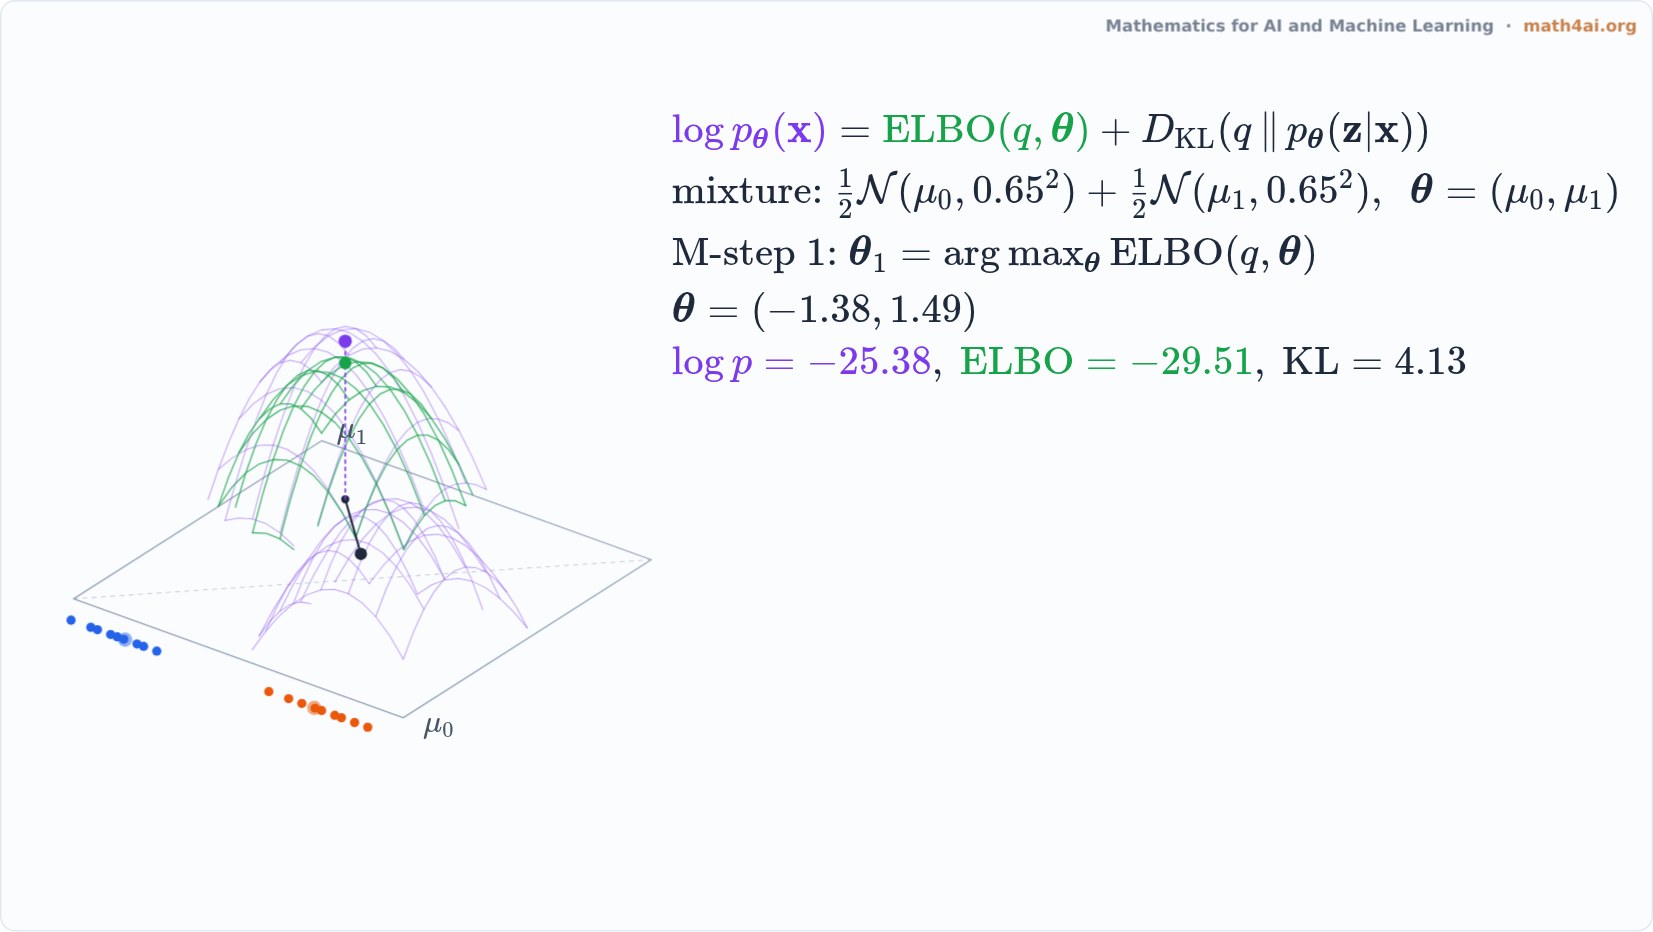 Preview1:36Expectation Maximization: Coordinate Ascent on the Lower BoundChapter 16