The Graph Laplacian: Smooth and Rough Signals on a Graph
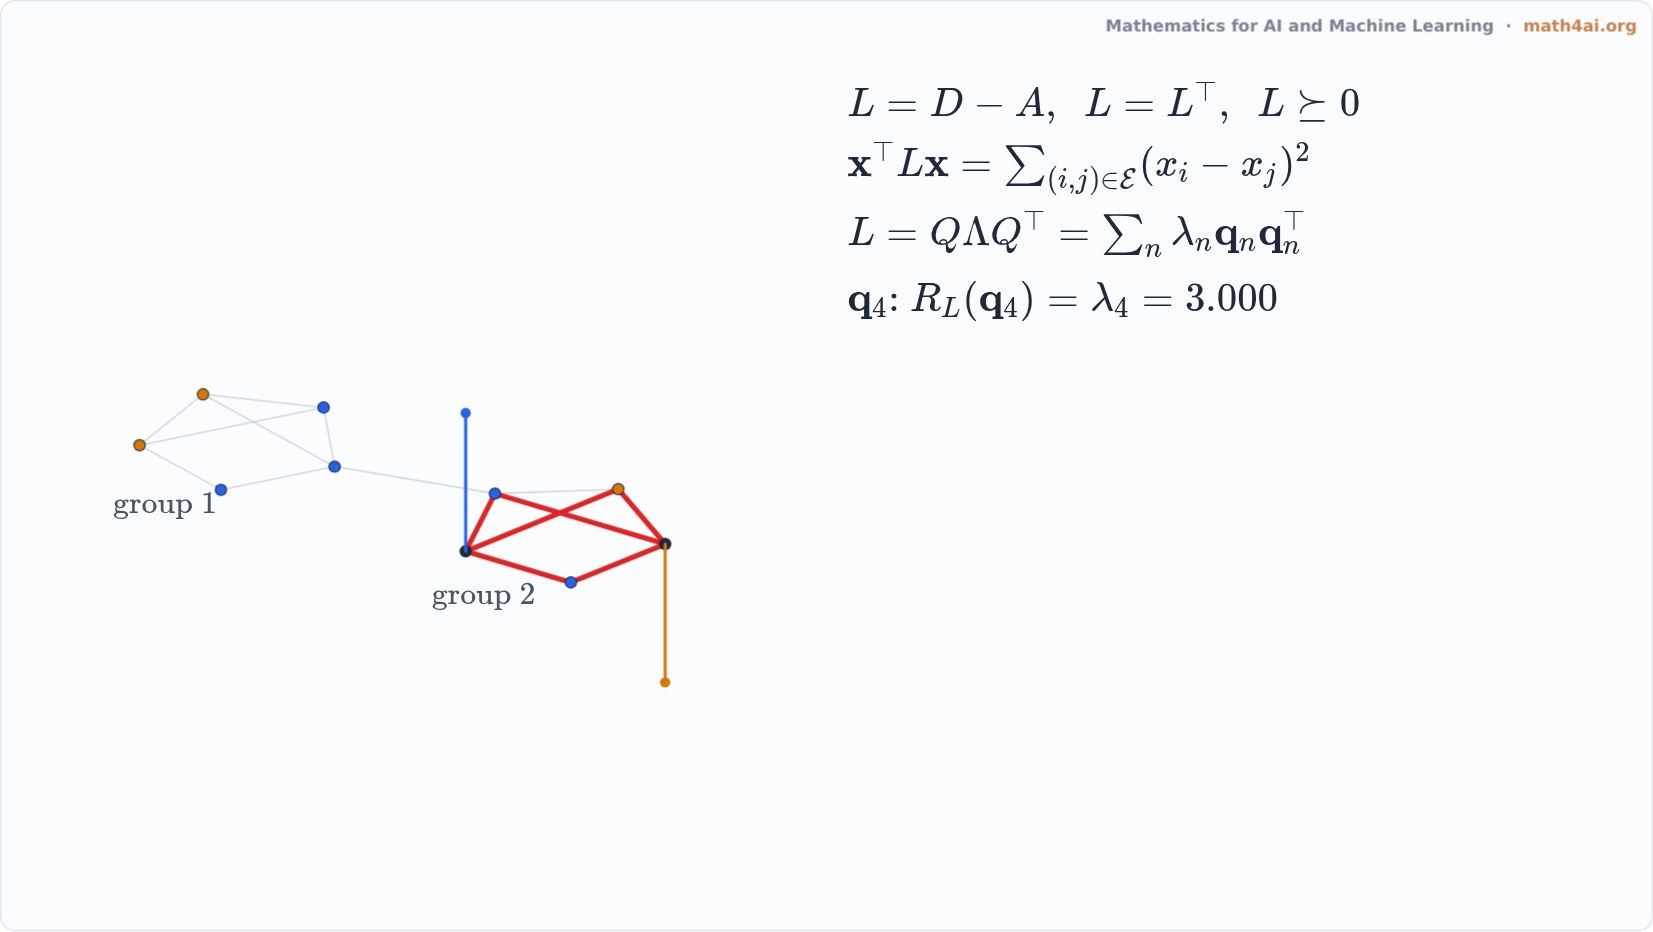
An interactive live film: graph Fourier modes shown as heights on two groups joined by a bridge; edges glow where neighbours differ, and each mode's eigenvalue is its cost. Find the mode that splits the graph in two.
Narration
Here is a graph with ten nodes: two groups of five, joined by a single bridge edge.
Its adjacency matrix A marks the edges, its degree matrix D counts them at each node, and the Laplacian is D minus A. All three are symmetric.
The rest of the narration is in the book's Companion.
More from Chapter 7
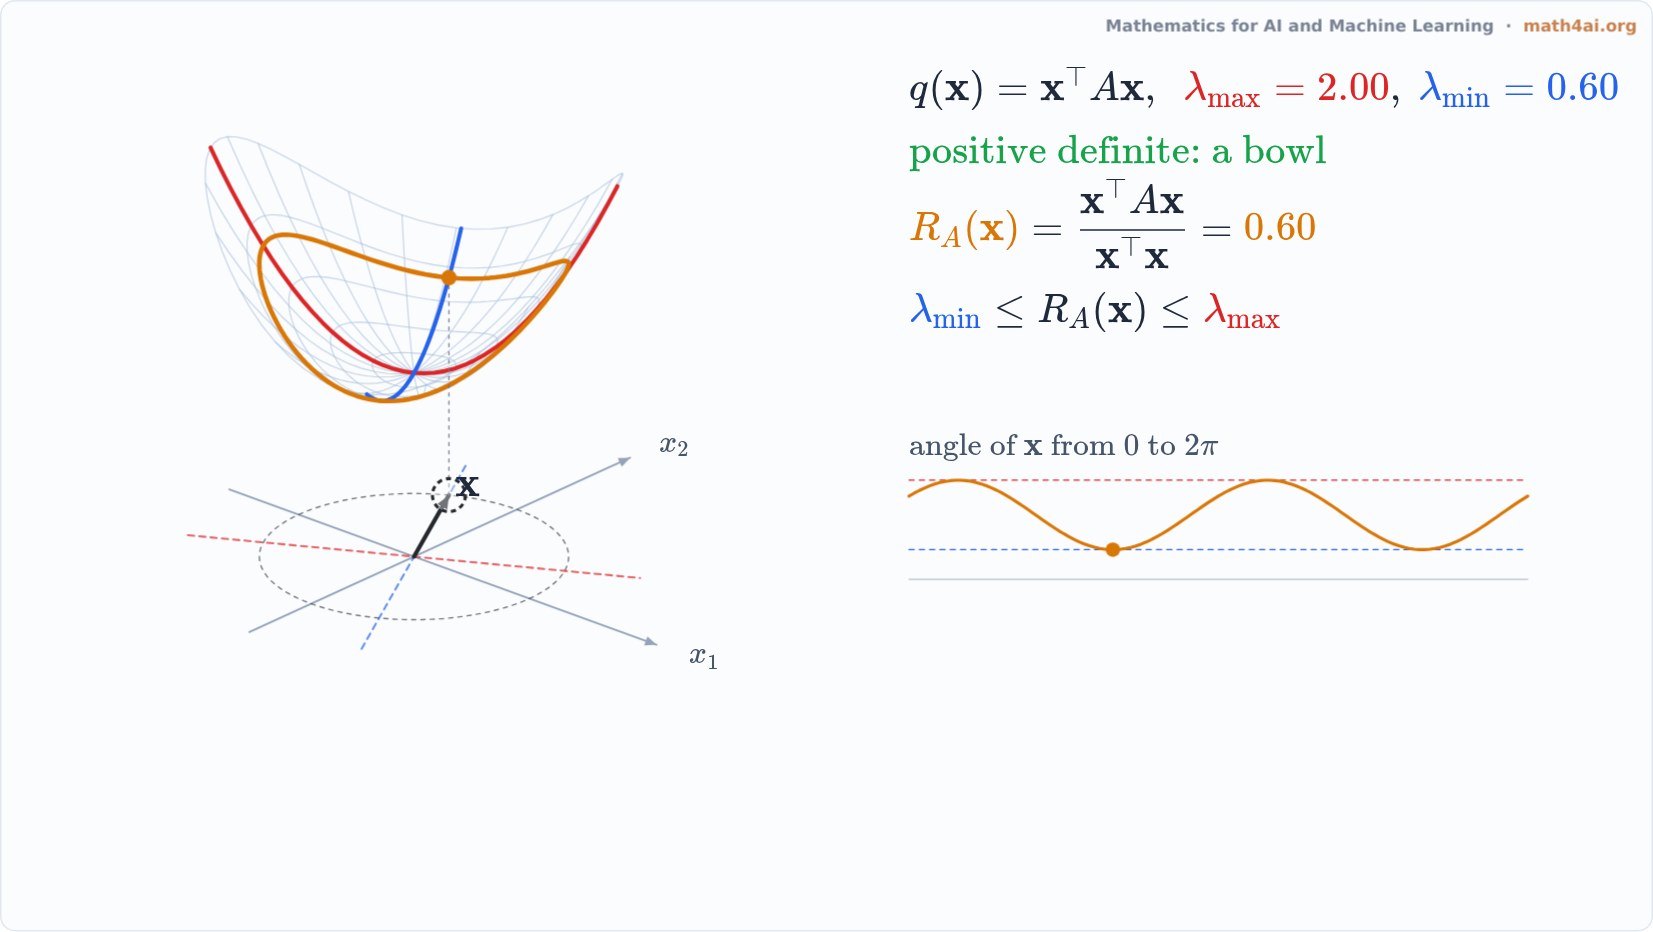 Interactive1:44Rayleigh Quotient: The Height of a Quadratic Form on the Unit CircleChapter 7
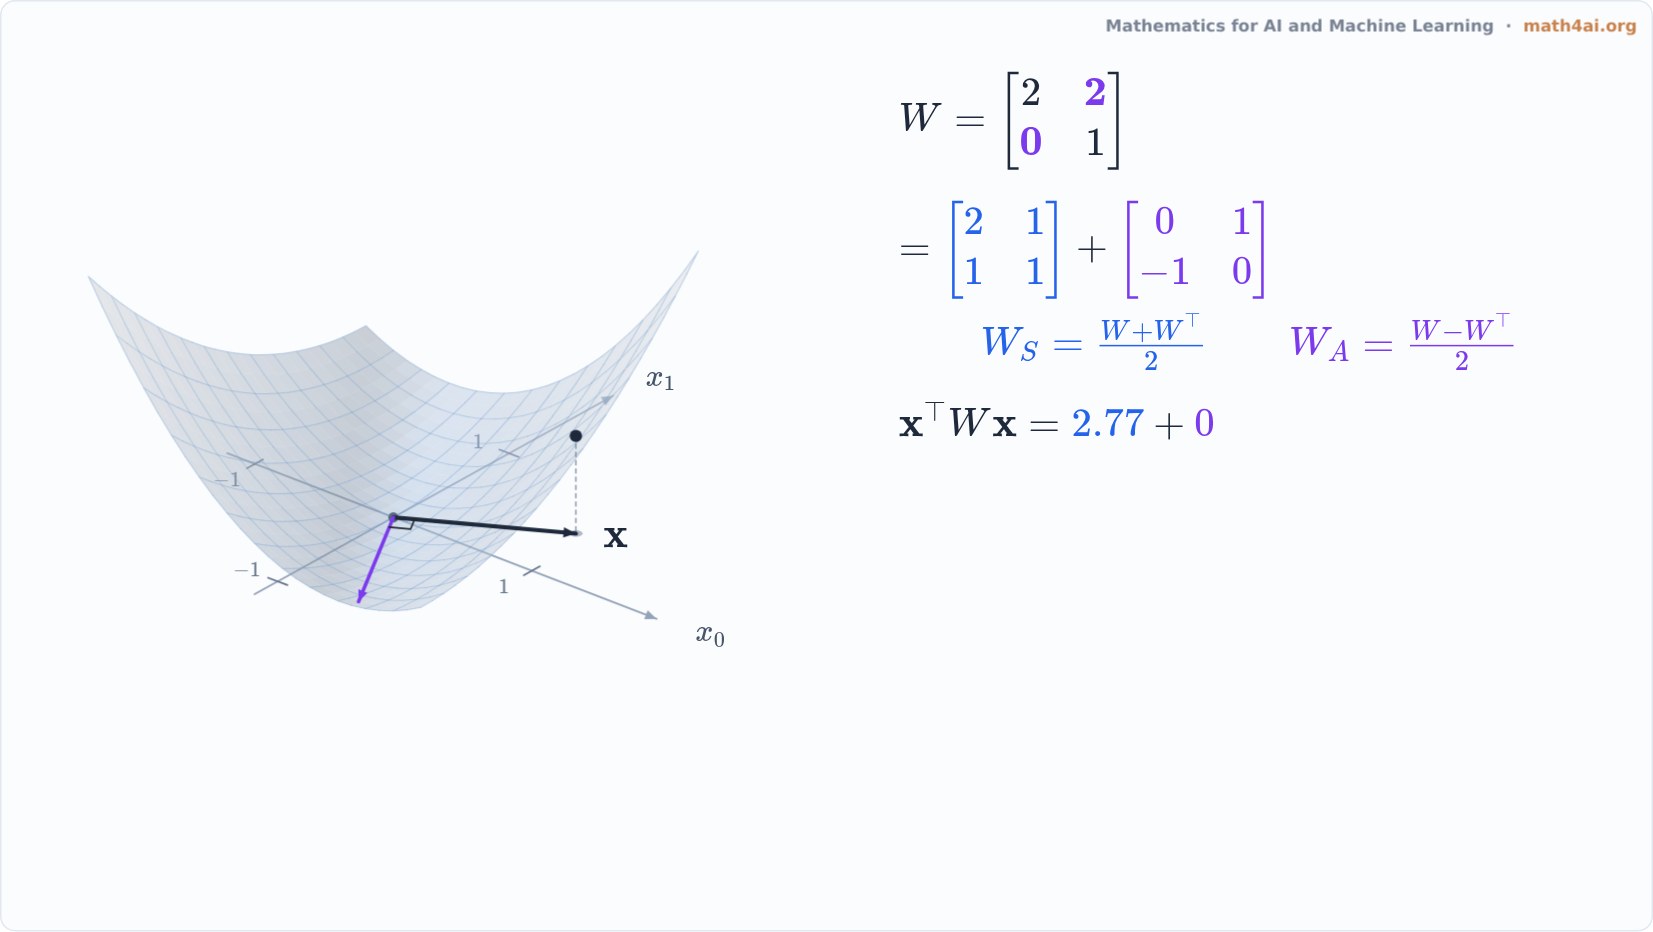 Preview1:29Quadratic Forms See Only the Symmetric PartChapter 7
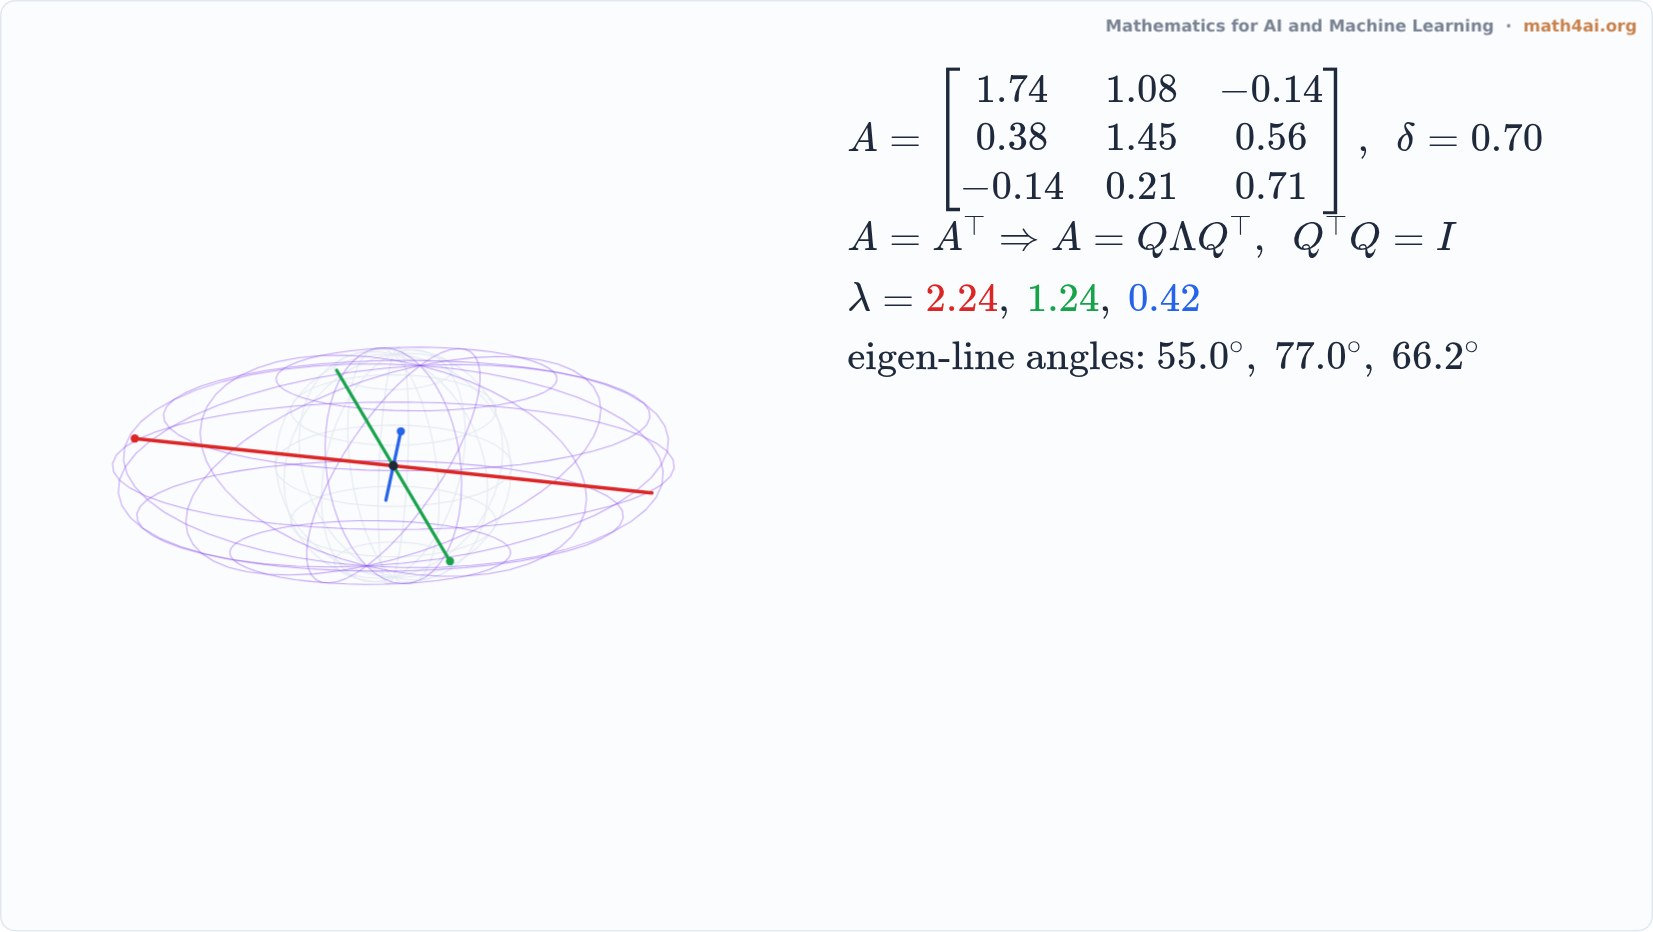 Preview1:29The Spectral Theorem: Symmetric Means Perpendicular EigenvectorsChapter 7
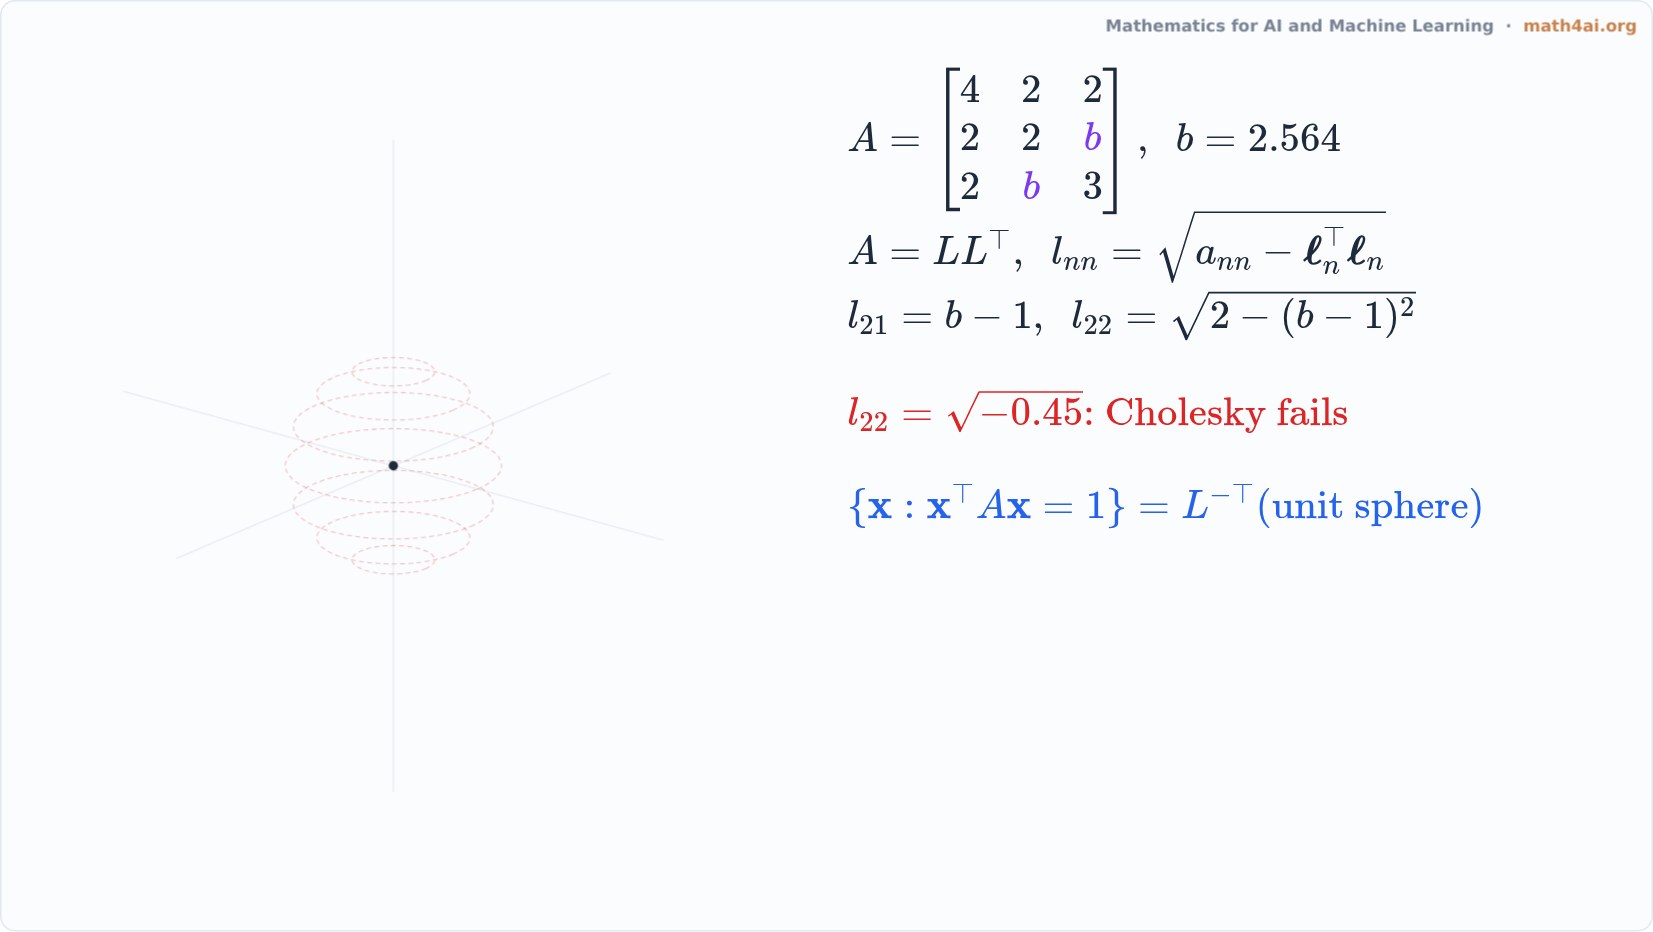 Preview1:35Cholesky: a Square Root That Exists Only for Positive Definite MatricesChapter 7
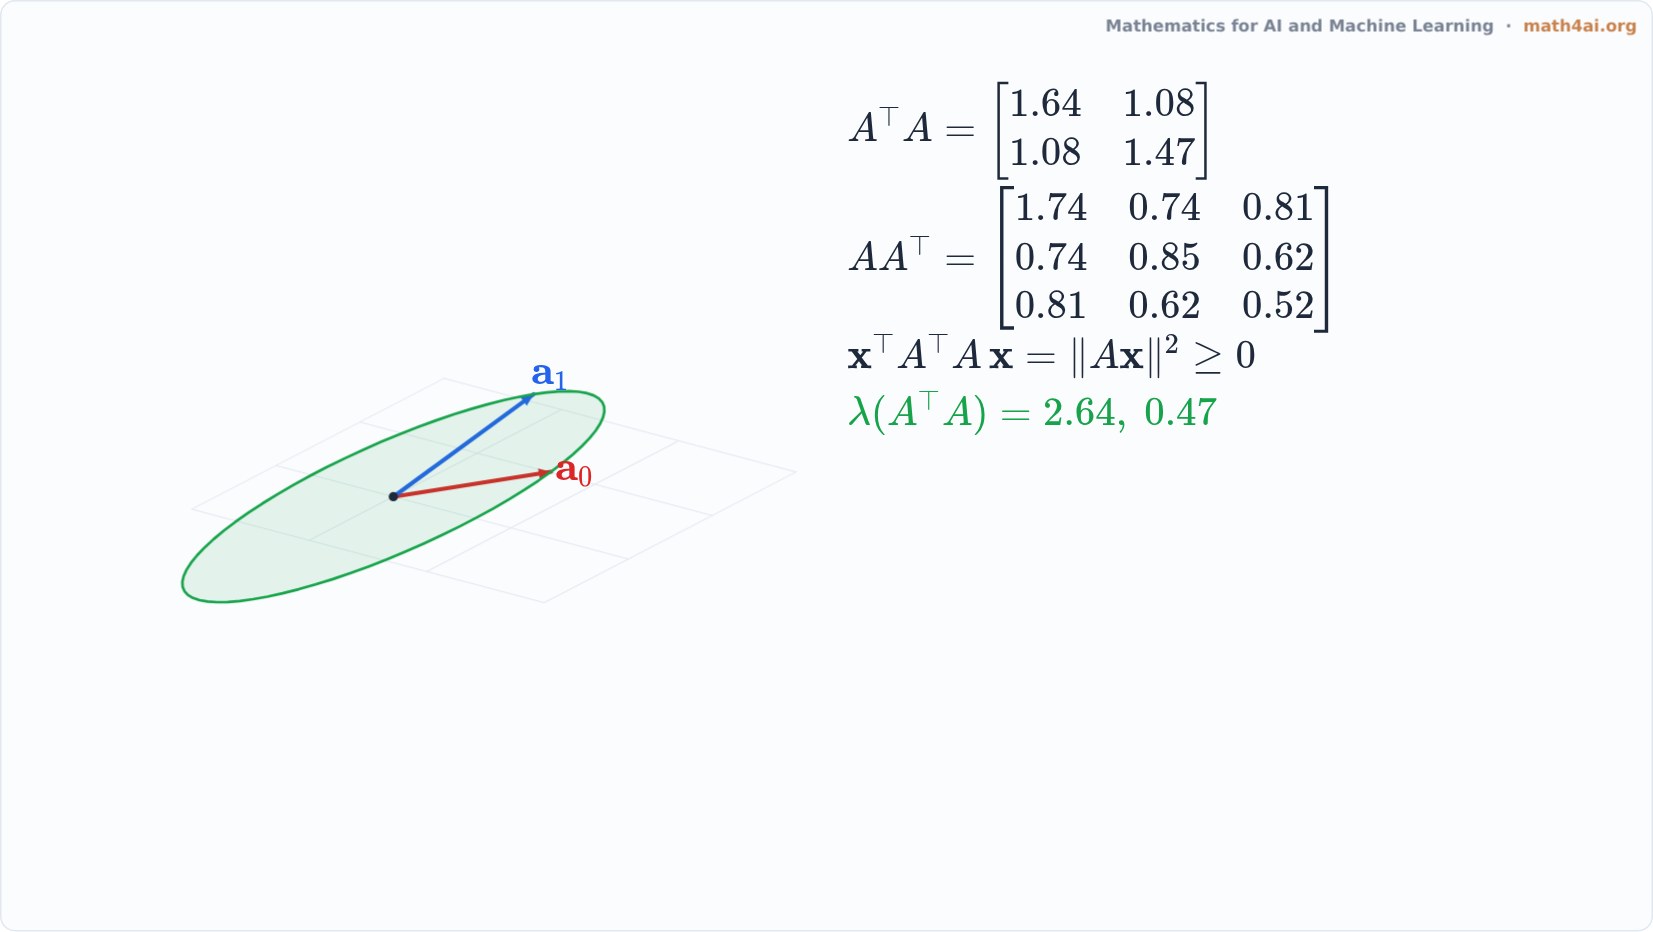 Preview1:40Gram Matrices: Two of Them, One Set of EigenvaluesChapter 7
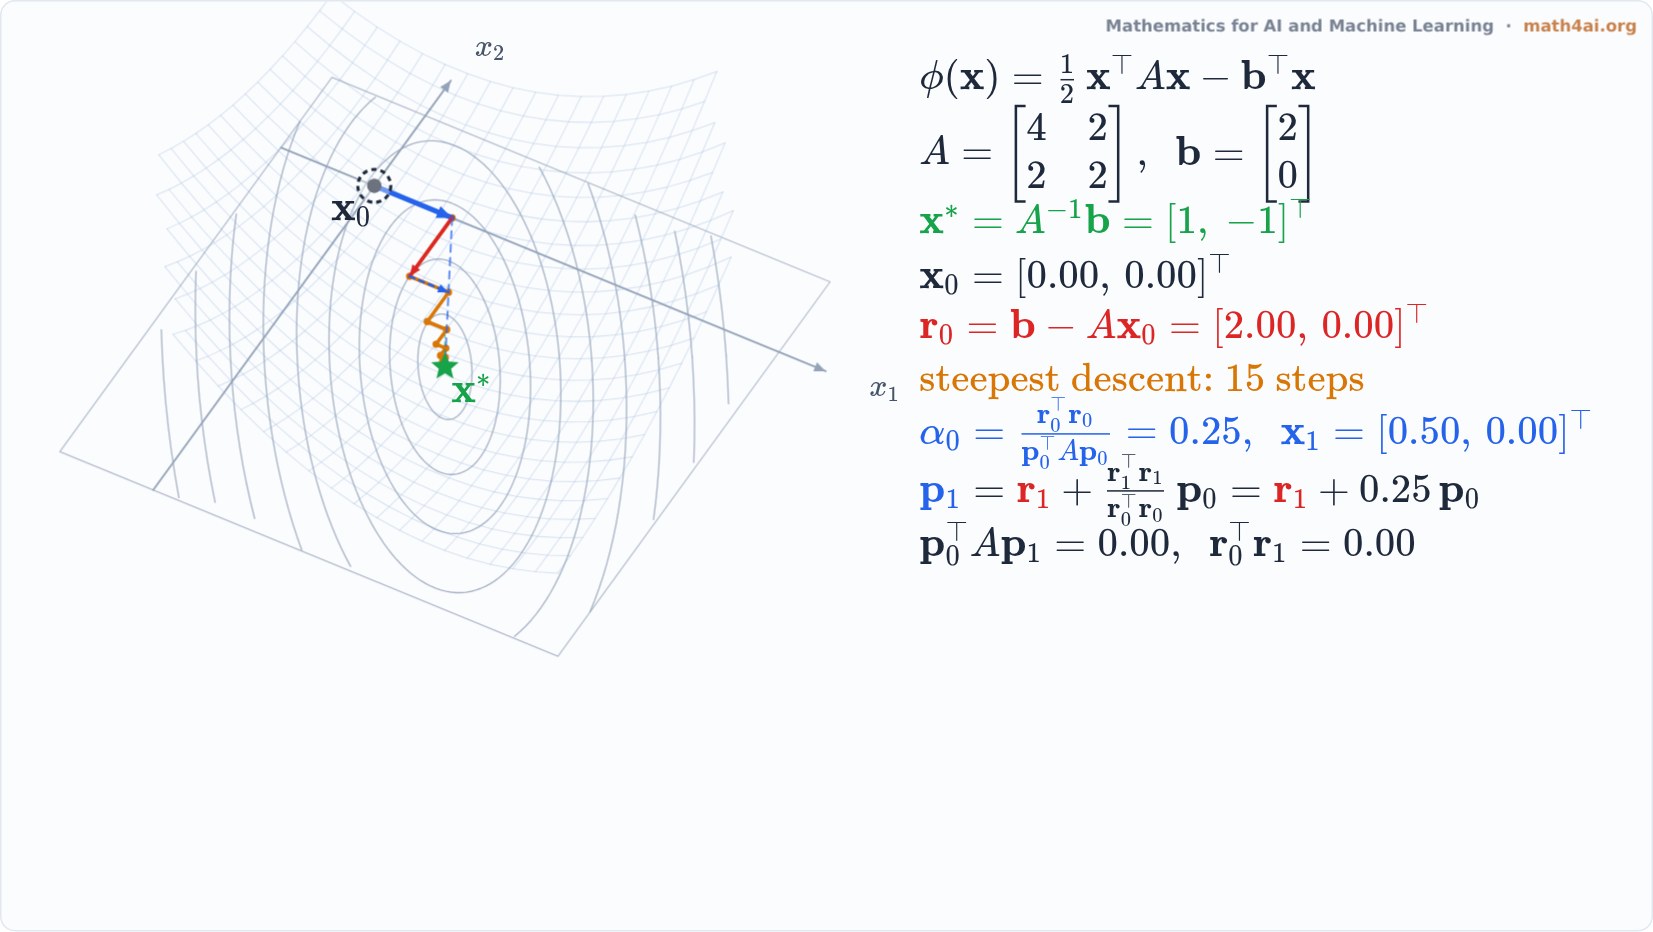 Preview1:58Conjugate Gradient: Two Steps to the BottomChapter 7