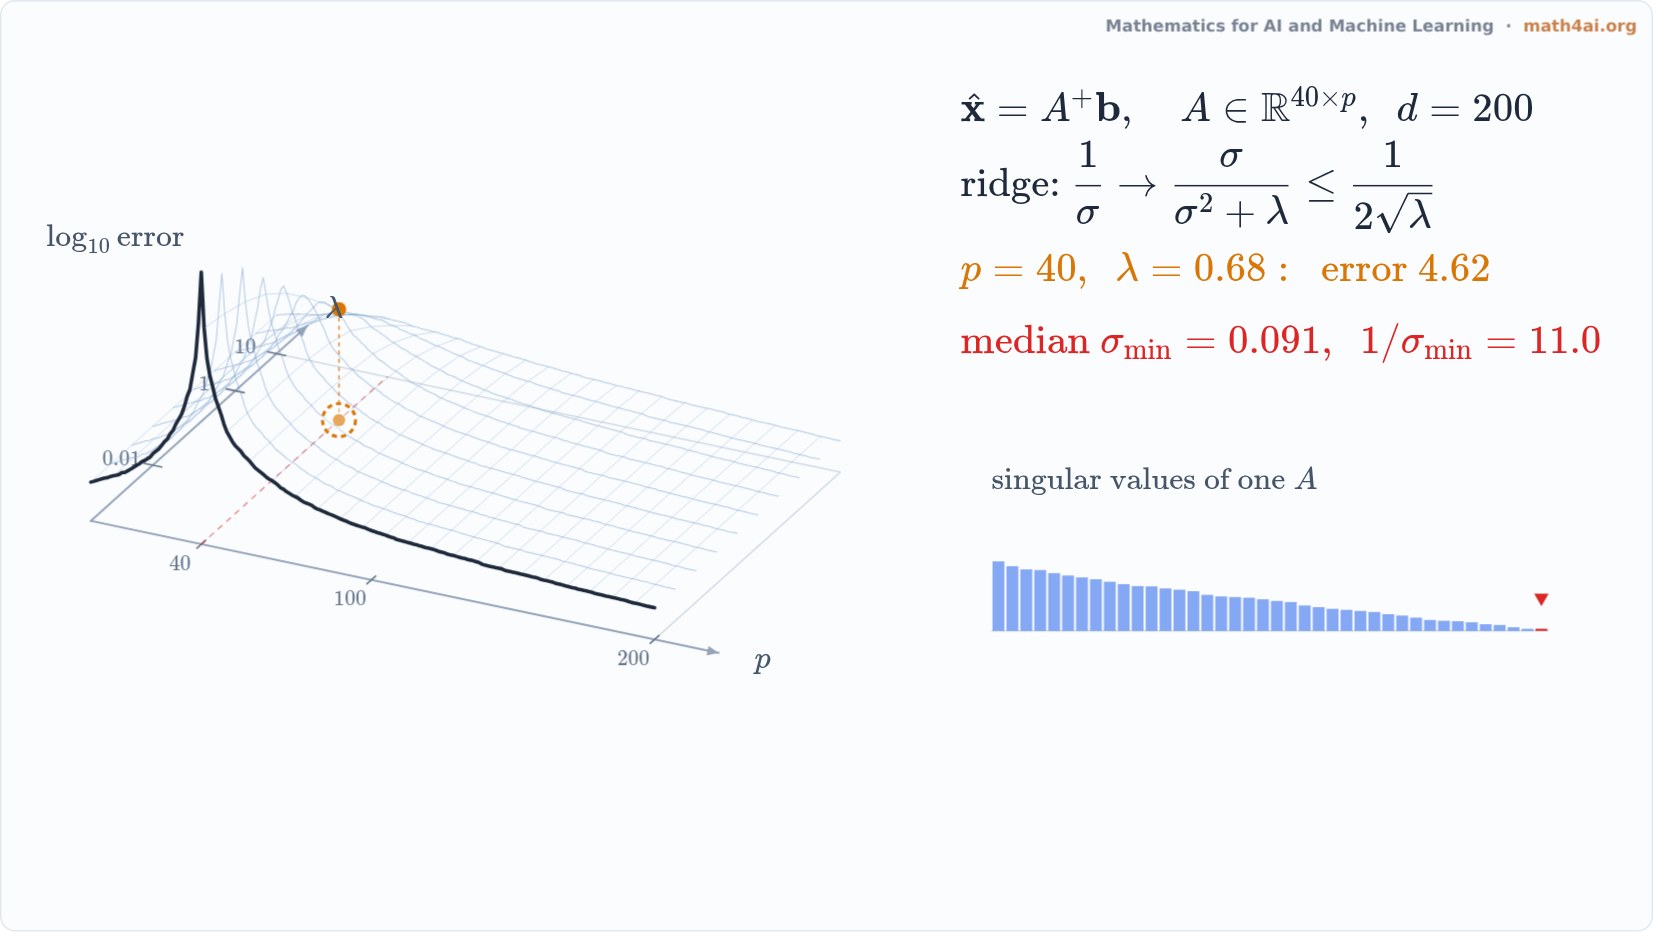
Double Descent at the Interpolation Threshold
An interactive live film: the test error of minimum-norm least squares as a surface over the number of features and the ridge penalty; the peak at p = n comes from the vanishing smallest singular value.
Narration
We fit forty noisy samples of a linear target that uses two hundred features, keeping only the first p features, with the minimum norm least squares solution.
The dark curve along the front of the surface is the test error as p grows. It rises, explodes at p equal to forty, the number of samples, and then falls again, below where it started. This is double descent.
The rest of the narration is in the book's Companion.
More from Chapter 8
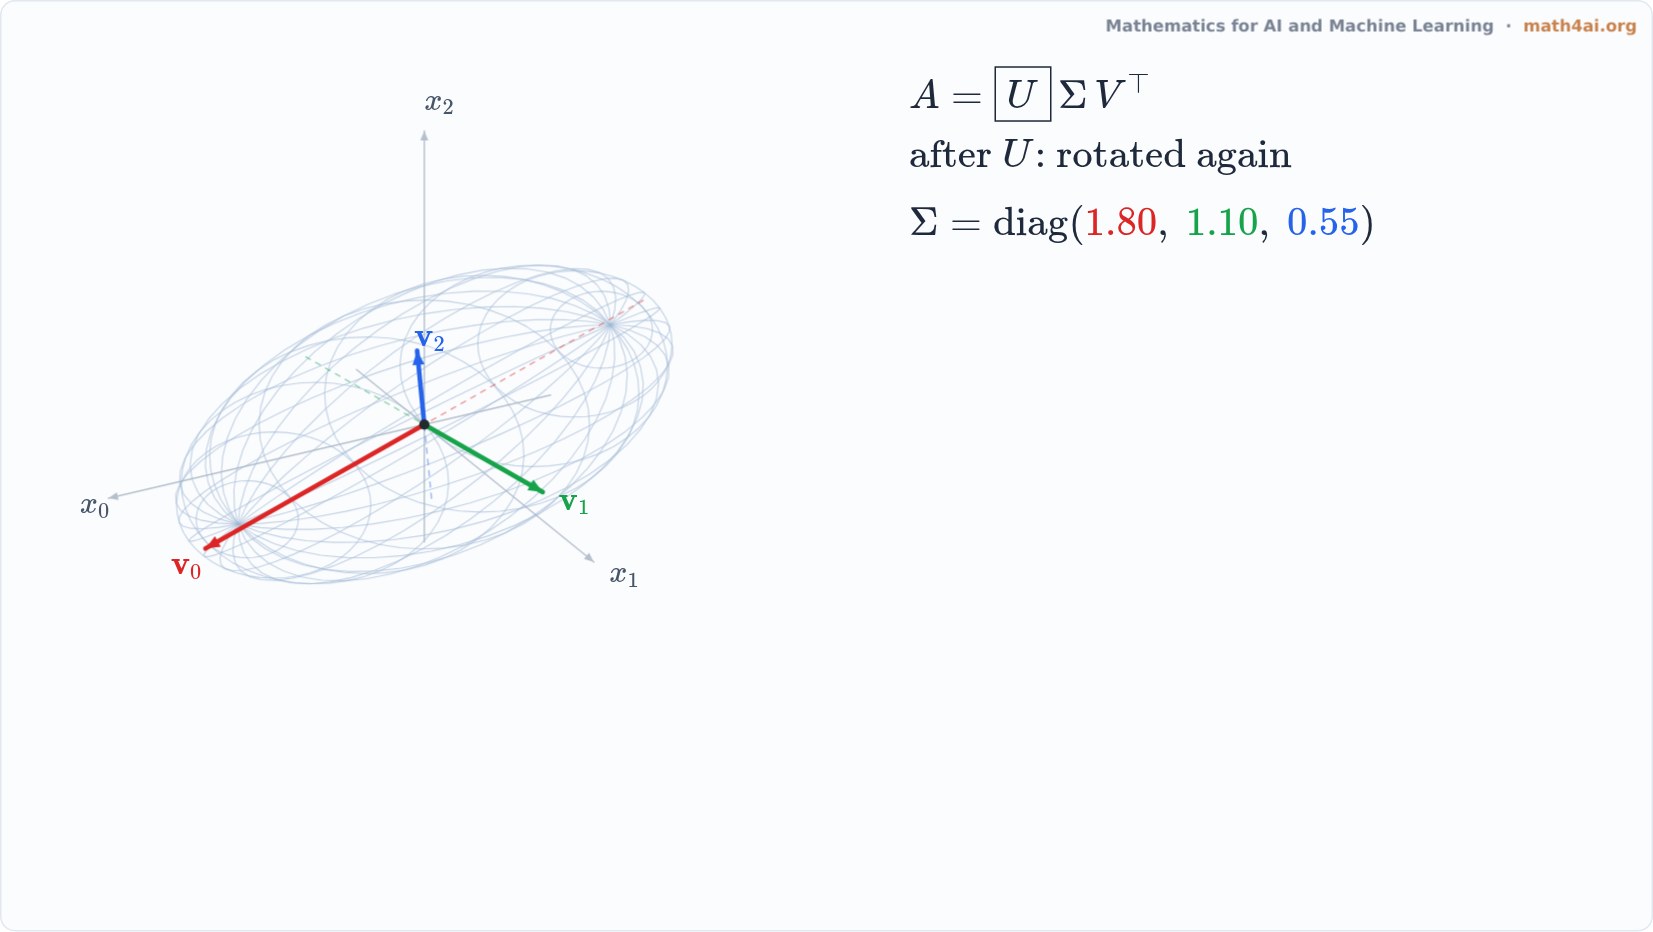 Interactive1:49SVD: Rotate, Stretch, RotateChapter 8
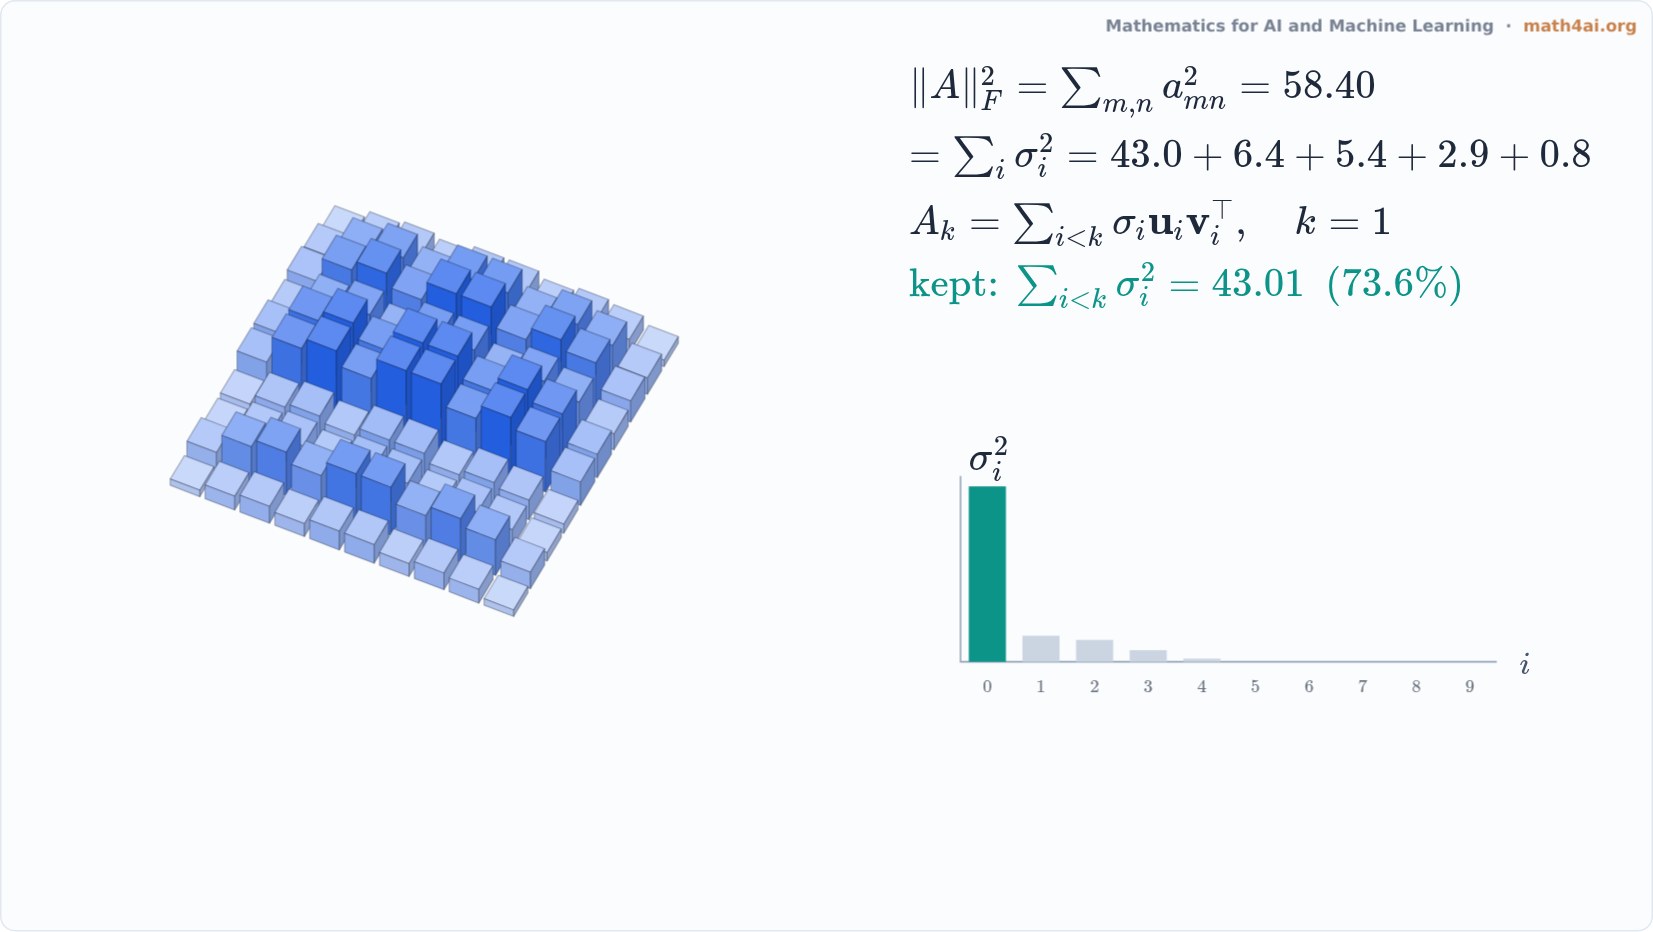 Preview1:31Energy from Singular Values: Rebuild a Picture Layer by LayerChapter 8
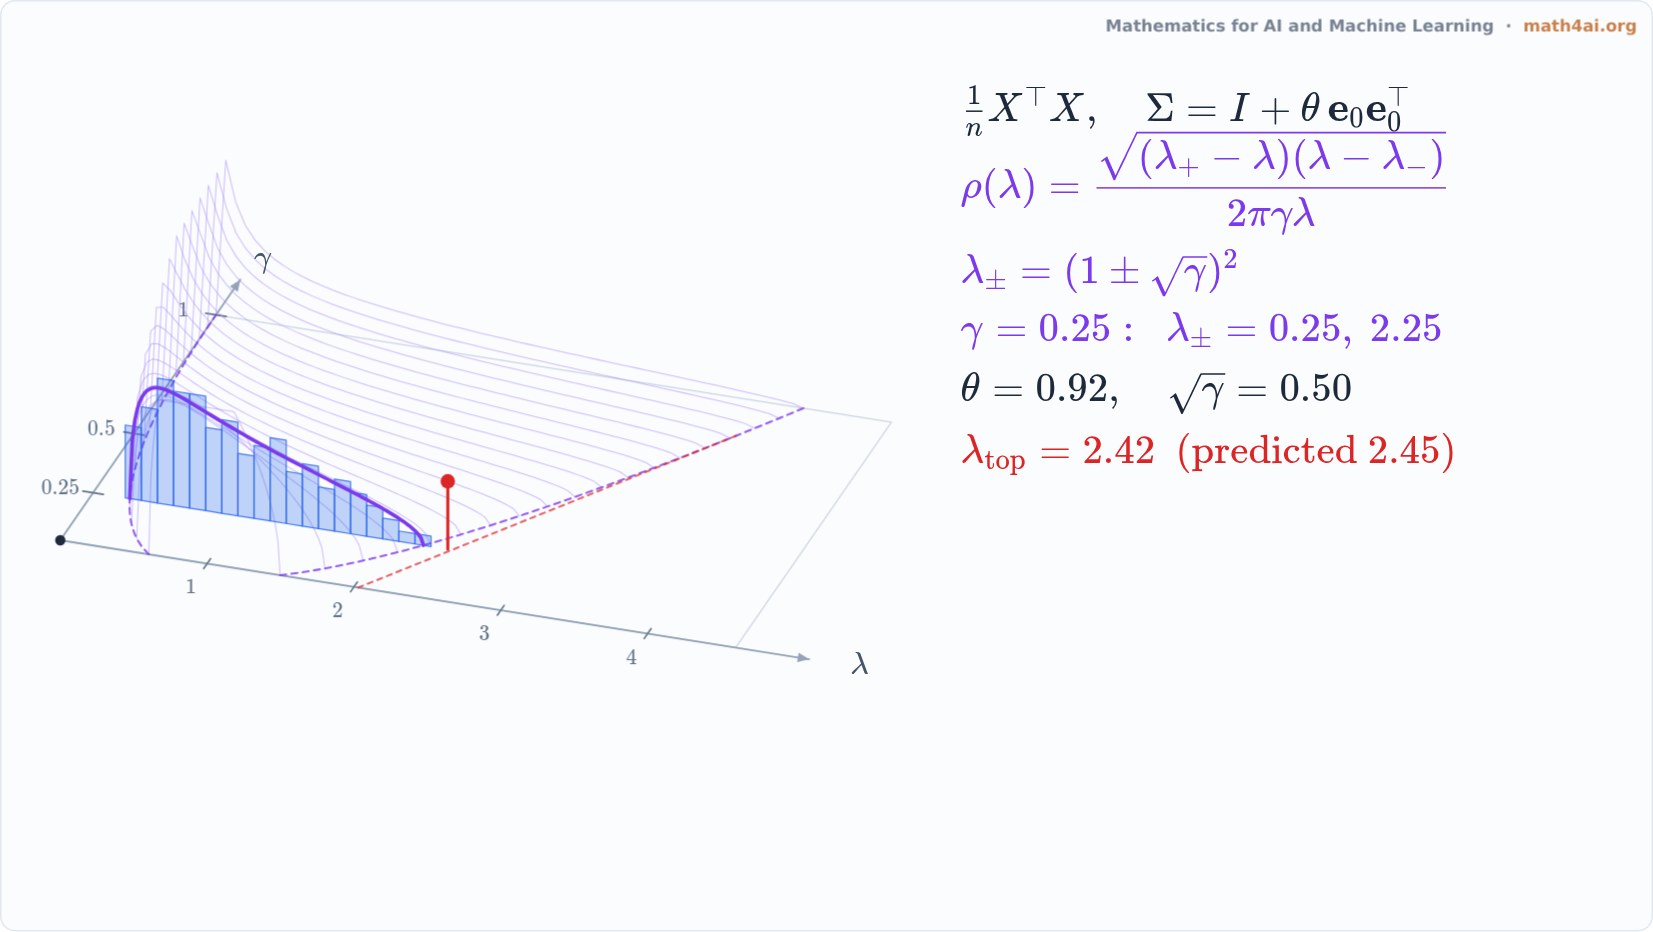 Preview1:32The Marchenko-Pastur Law and the Escaping EigenvalueChapter 8
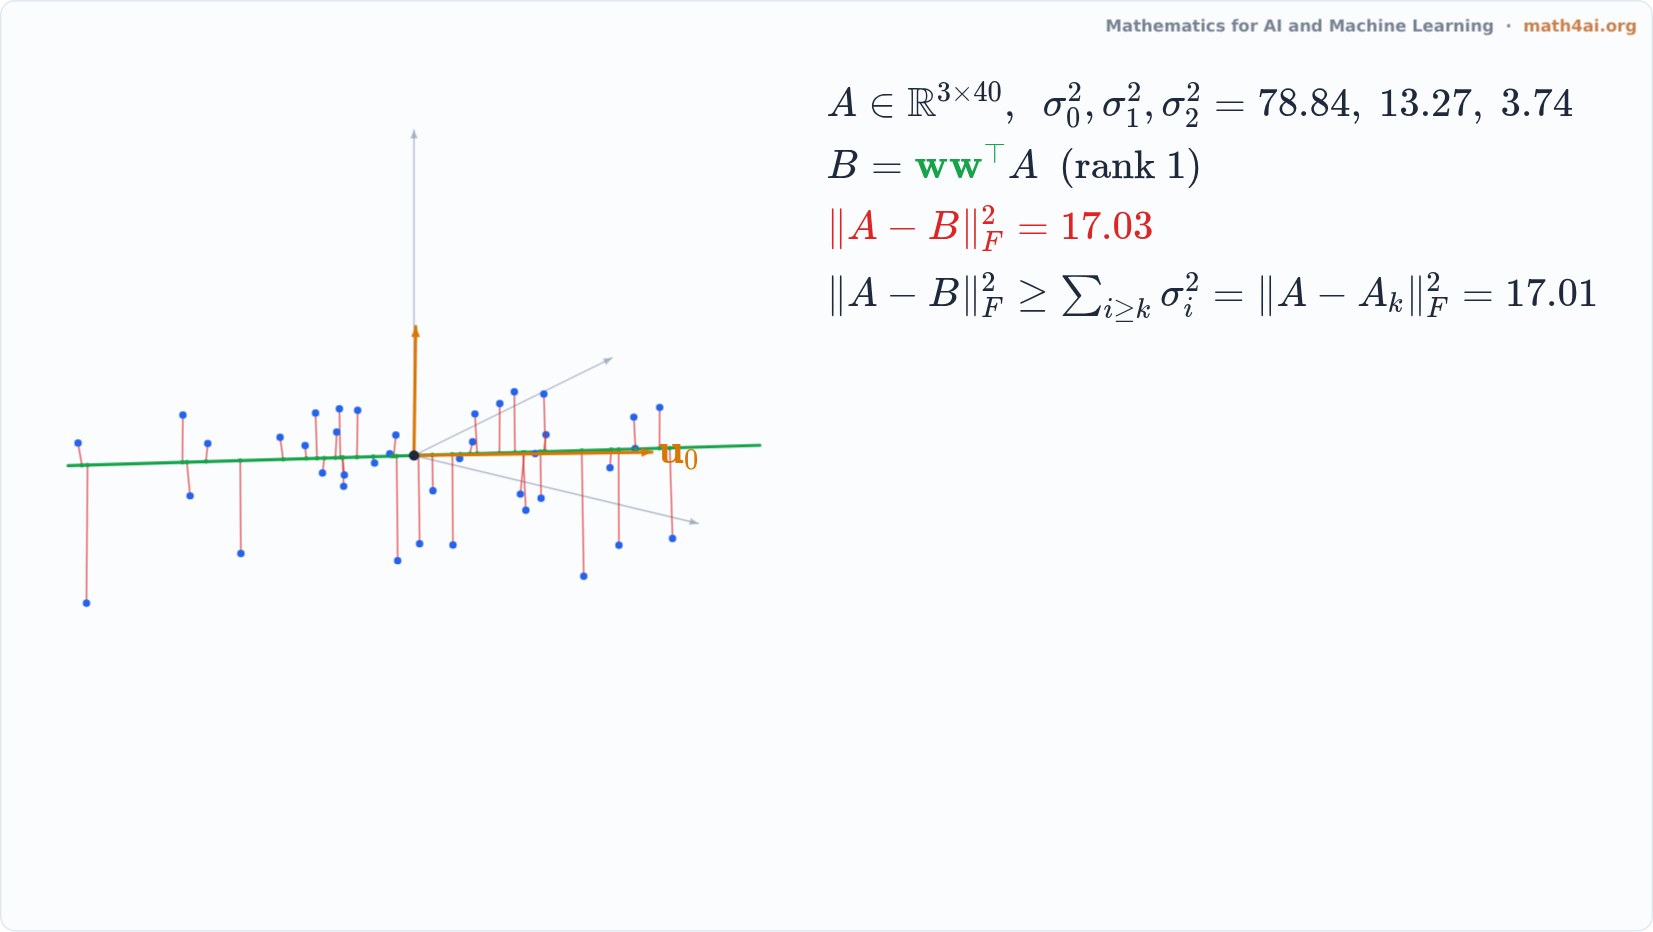 Preview1:43Eckart-Young: the Best Low-Rank ApproximationChapter 8
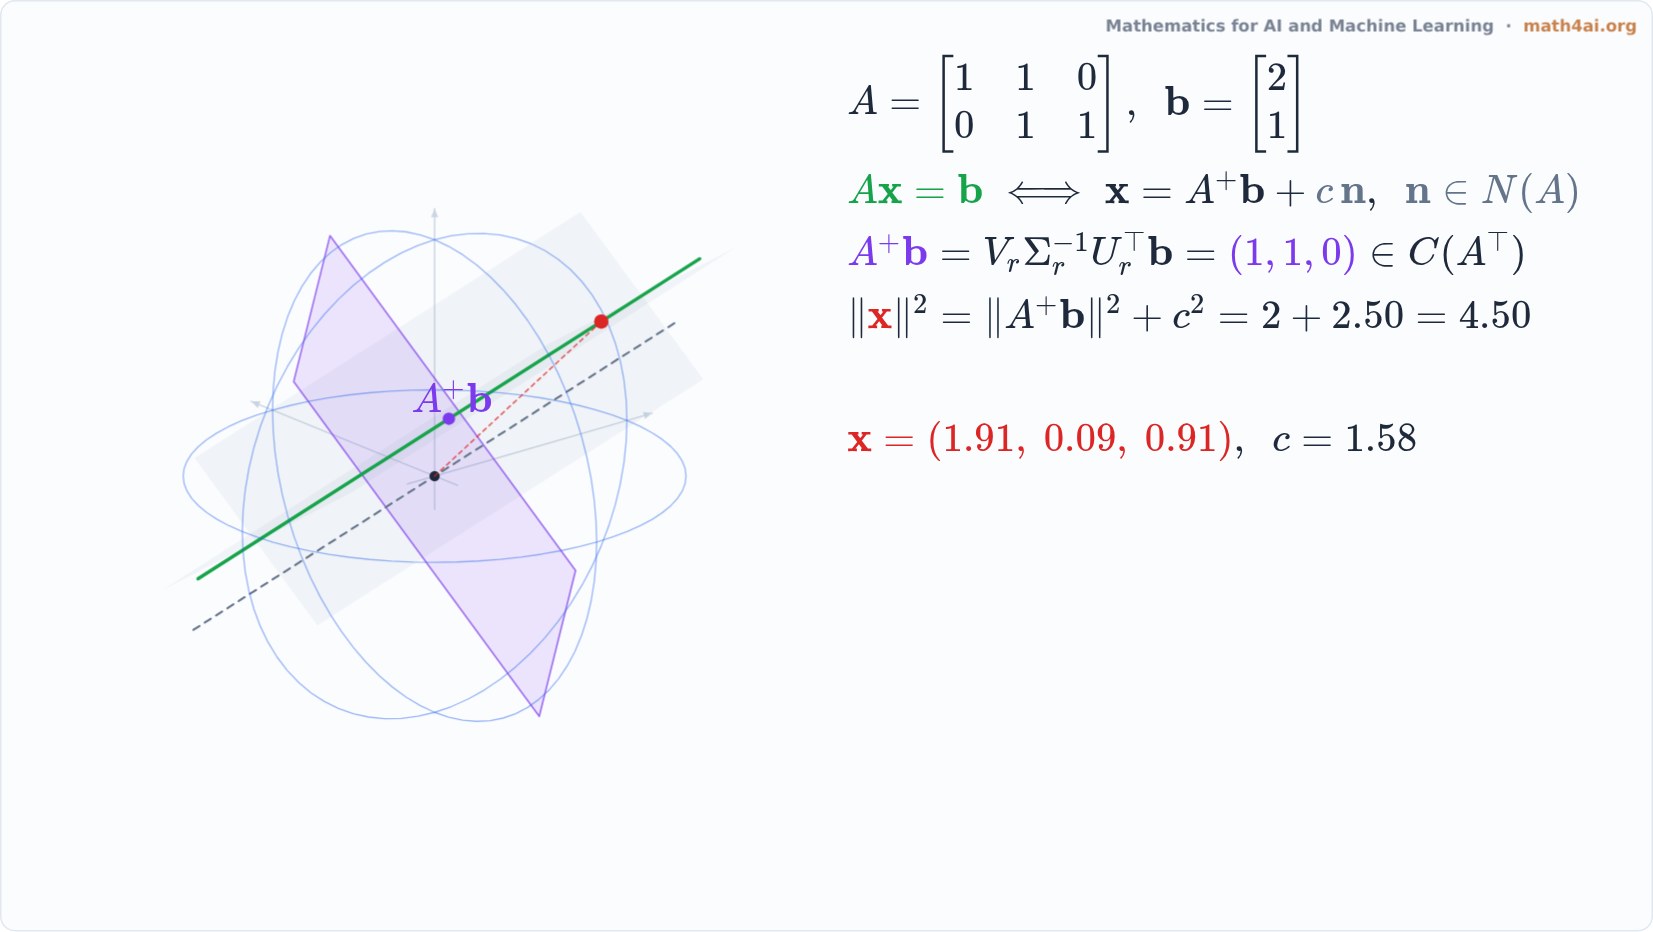 Preview1:46The Pseudoinverse: the Shortest SolutionChapter 8
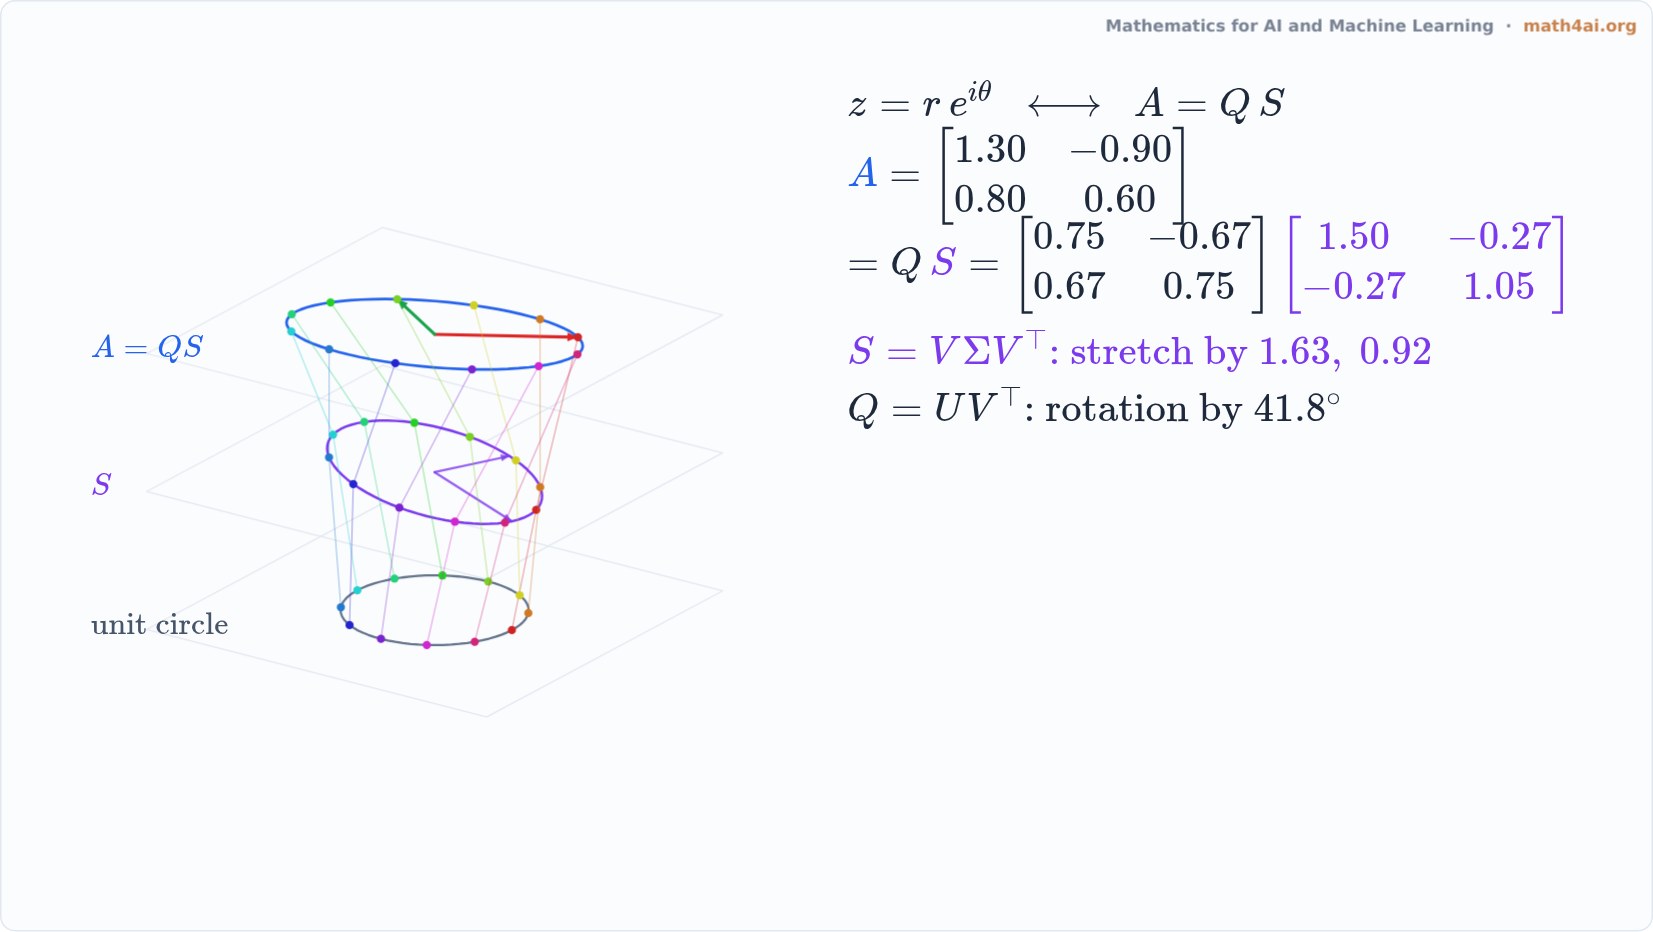 Preview1:31Polar Decomposition: Stretch, then RotateChapter 8
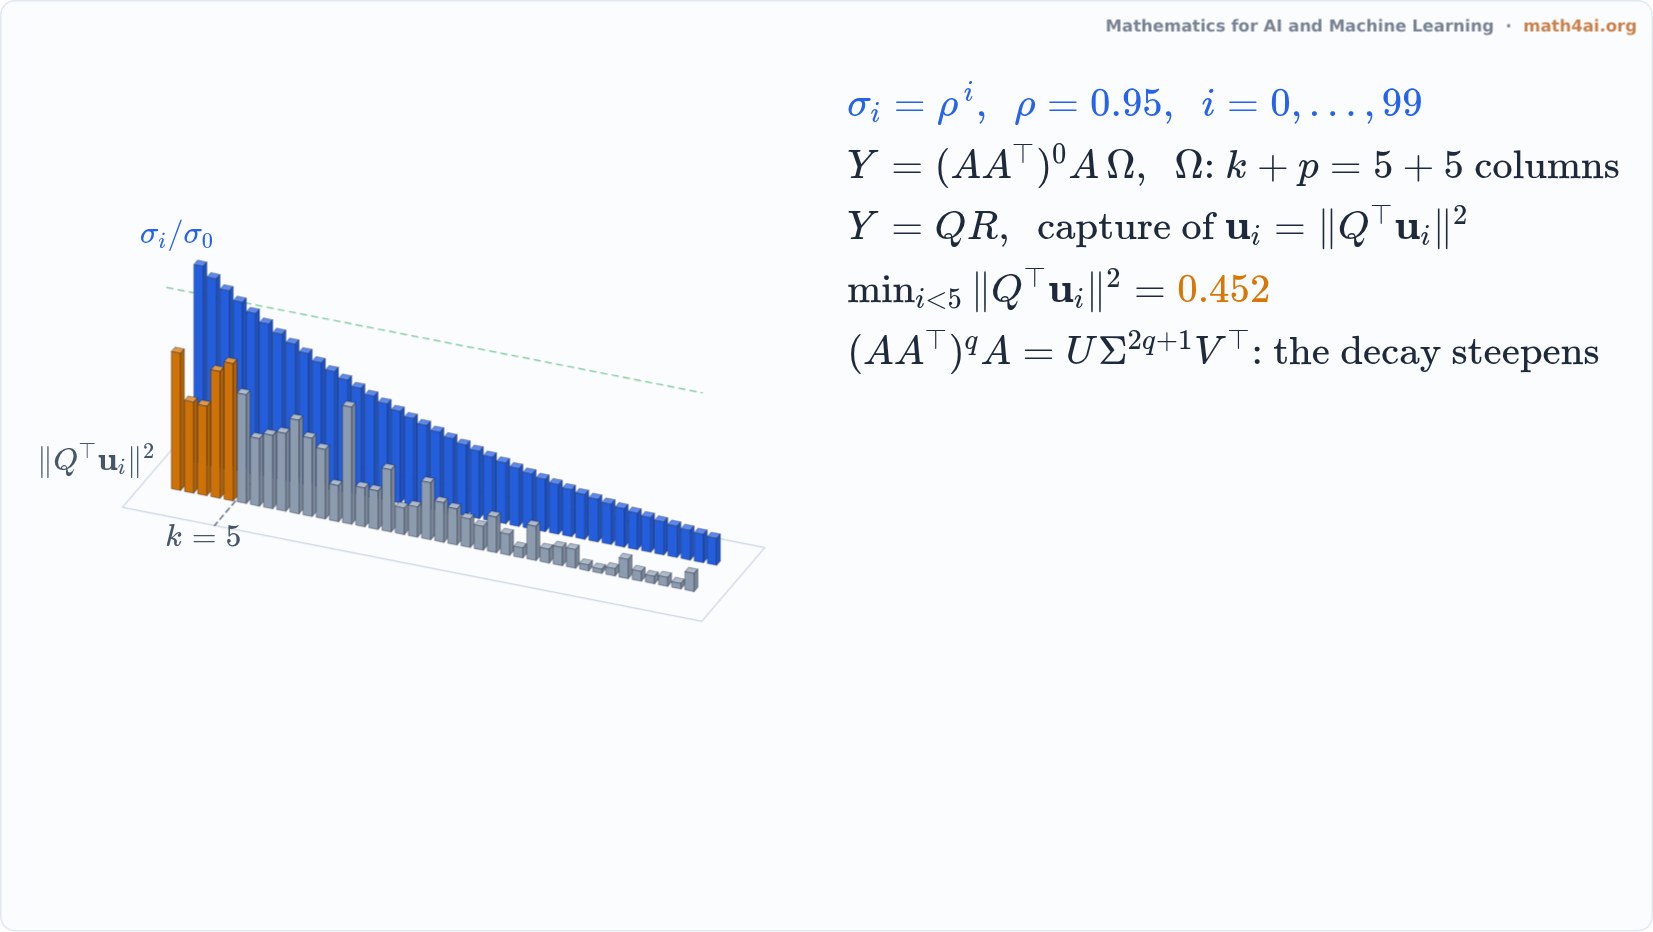 Preview1:47Randomized SVD: Catching the Top DirectionsChapter 8